
Research · July 7, 2026
Building a data-driven SEC filing risk-factor taxonomy
265,787 risk-factor phrases → 67 clusters → ~30 stable categories.
Every 10-K and 10-Q has an “Item 1A. Risk Factors” section, and buried in the boilerplate are the specific things a company is telling investors it’s actually worried about. The problem is every filer writes it differently, so raw risk-factor text isn’t comparable across companies or sectors on its own.
WealthWire’s pipeline extracts each individual risk factor from a filing with an LLM, then maps it onto a fixed taxonomy of ~30 categories so factors become comparable and aggregatable. To come up with this taxonomy, we use the risk factors extracted from filings since 2020 for S&P 500 companies, so the fixed taxonomy stays up to date with emerging categories. Our taxonomy discovery pipeline clusters the actual extracted risk-factor phrases and lets the categories emerge from the data, then the clusters are manually inspected to produce the final taxonomy.
The method
- Extract every unique risk-factor phrase the LLM has pulled out of filings so far (~265K unique phrases as of today).
- Embed each phrase, reduce dimensionality with UMAP, cluster with HDBSCAN — which can leave a phrase unclustered (“noise”, topic
-1) rather than force it into a bad-fit category (unlike simpler clustering methods such as k-means, which must assign every point to some cluster). - For each resulting cluster, look at its size, its top keywords, and a handful of representative documents to figure out what it actually is.
- Turn the clusters that are coherent and large enough to matter into taxonomy nodes by hand, writing a stable
id, a displaylabel/group, and adescription.
The raw clusters
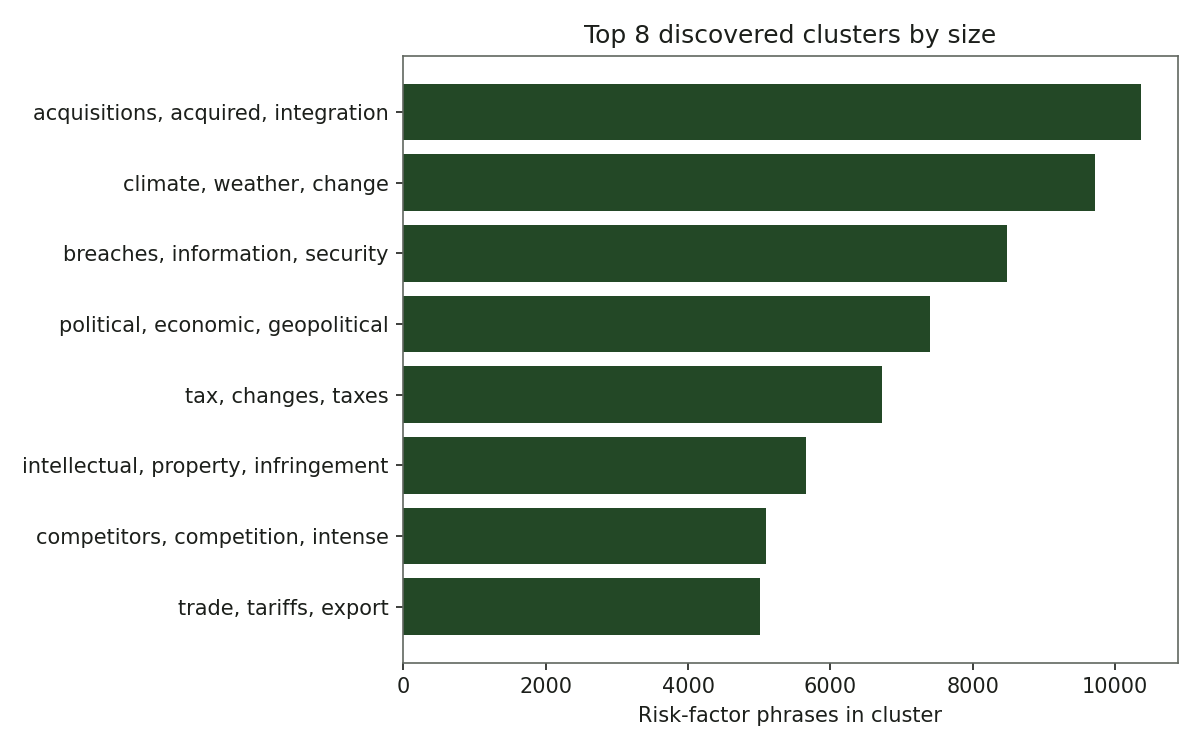
After tuning the clustering model we end up with 67 clusters. Below are the largest, by number of risk factors in them — the raw material, before any human judgment gets applied, that eventually became taxonomy nodes like cybersecurity, supply_chain, and health_safety.
Seeing the clusters
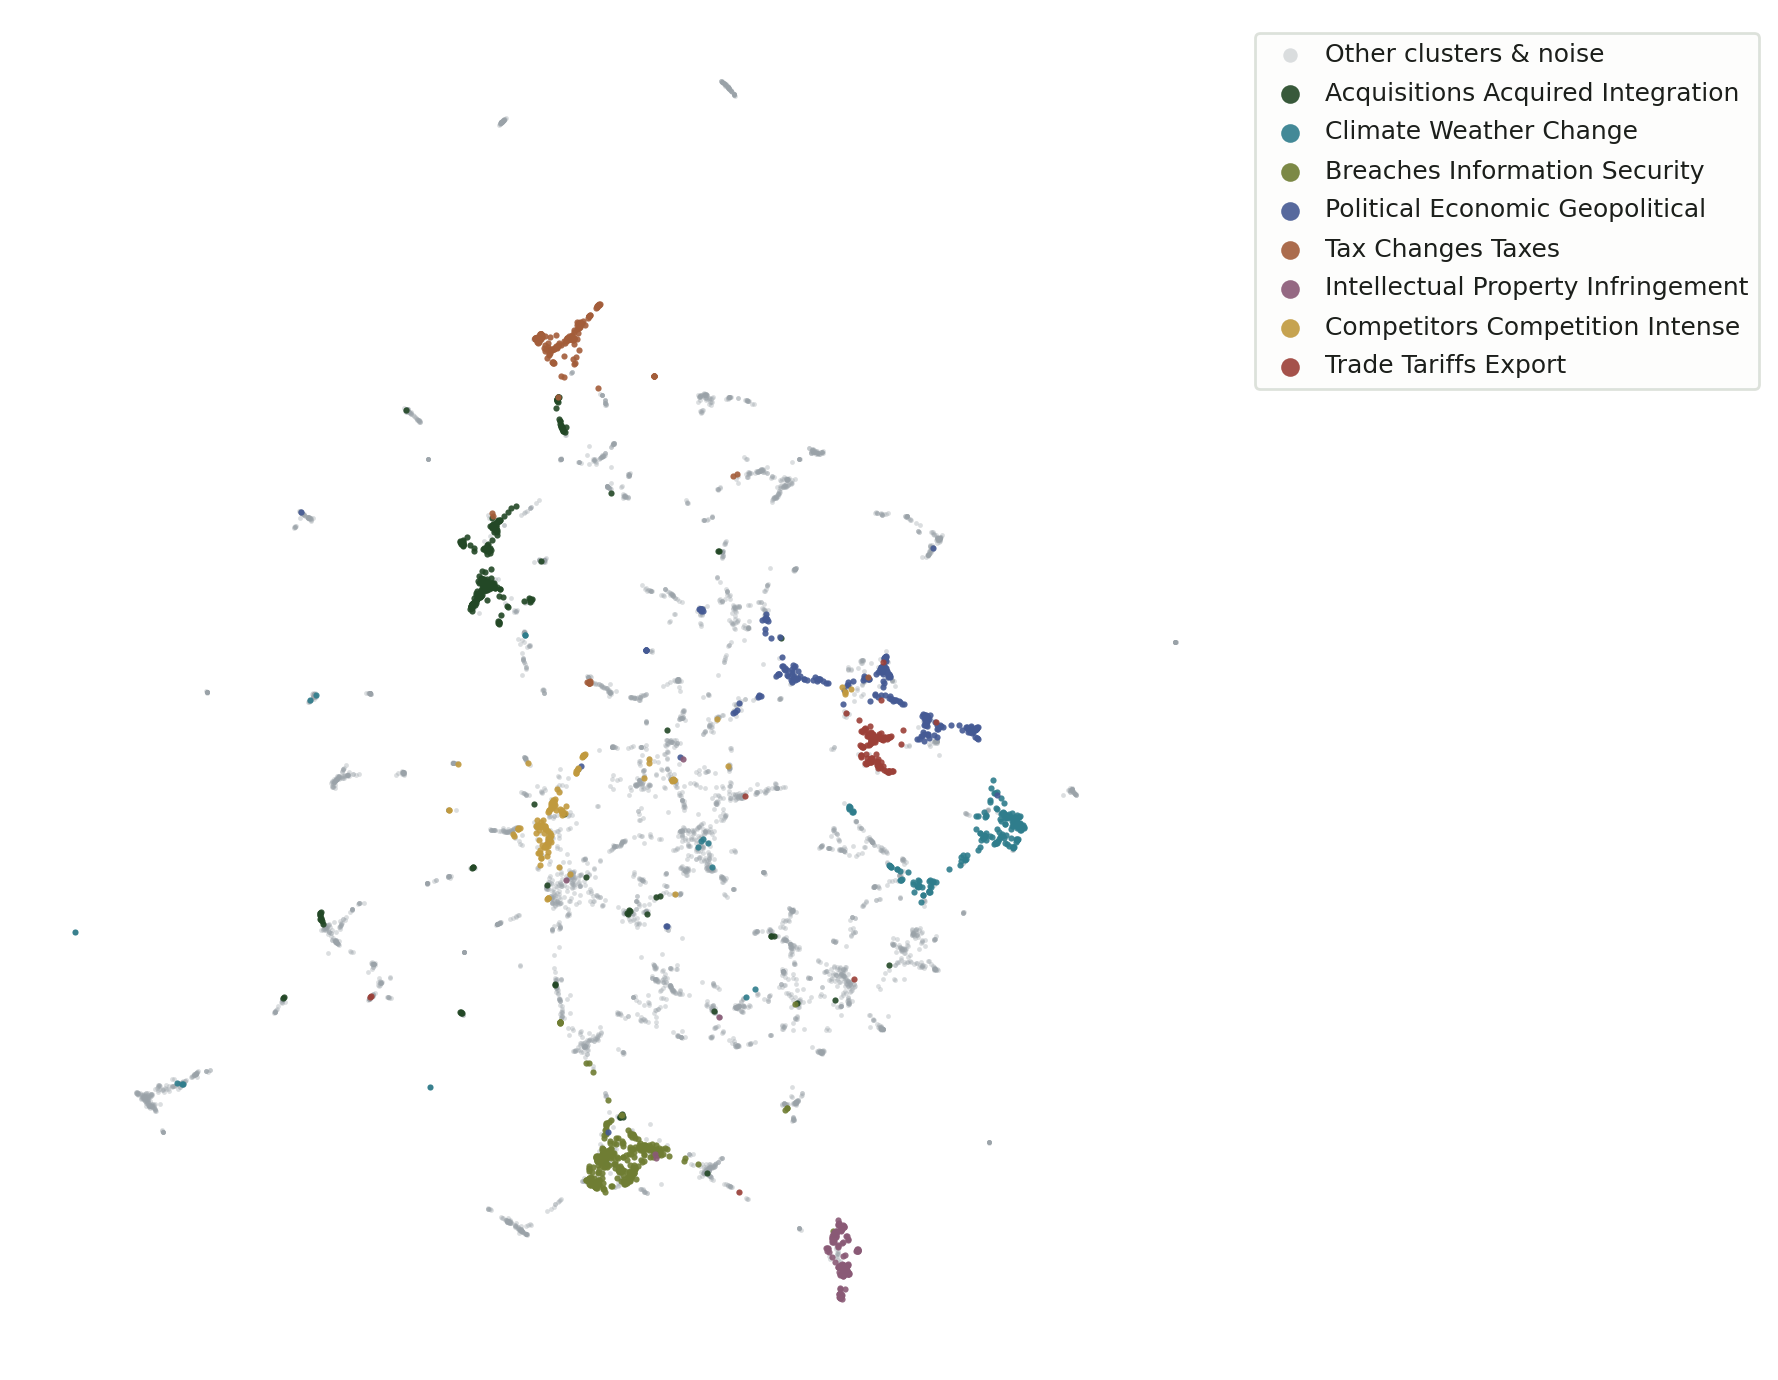
The bar chart shows cluster sizes, but not how distinct the clusters actually are from each other in the underlying phrase-embedding space. To see that, we project the cached sentence embeddings down to 2D with UMAP and color each point by its cluster. The top clusters land as clean, well-separated islands; everything else — including the noise bucket — fades into the gray background cloud.
The noise bucket
~72K phrases ended up in the noise bucket — everything HDBSCAN couldn’t confidently group. This is the honest part of the process: rather than force these into an artificial cluster, we leave them unassigned and eyeball a sample to check whether there’s a missed category hiding in there, or whether it’s genuinely a long tail of one-off, idiosyncratic risk factors that don’t recur often enough to deserve their own taxonomy node.
From clusters to taxonomy
Each coherent, sufficiently large cluster gets turned into a taxonomy node by hand — a stable id, a display label/group for the frontend, and a description written for the LLM that does the actual per-filing mapping later in the pipeline. Compare the cybersecurity cluster above to its taxonomy entry:
- id: cybersecurity
  label: Cybersecurity & Data
  group: Technology
  description: Security breaches, data loss, IT system failures, service
    outages, privacy-law exposure, and AI-enabled threats (e.g.
    generative-AI-powered attacks).
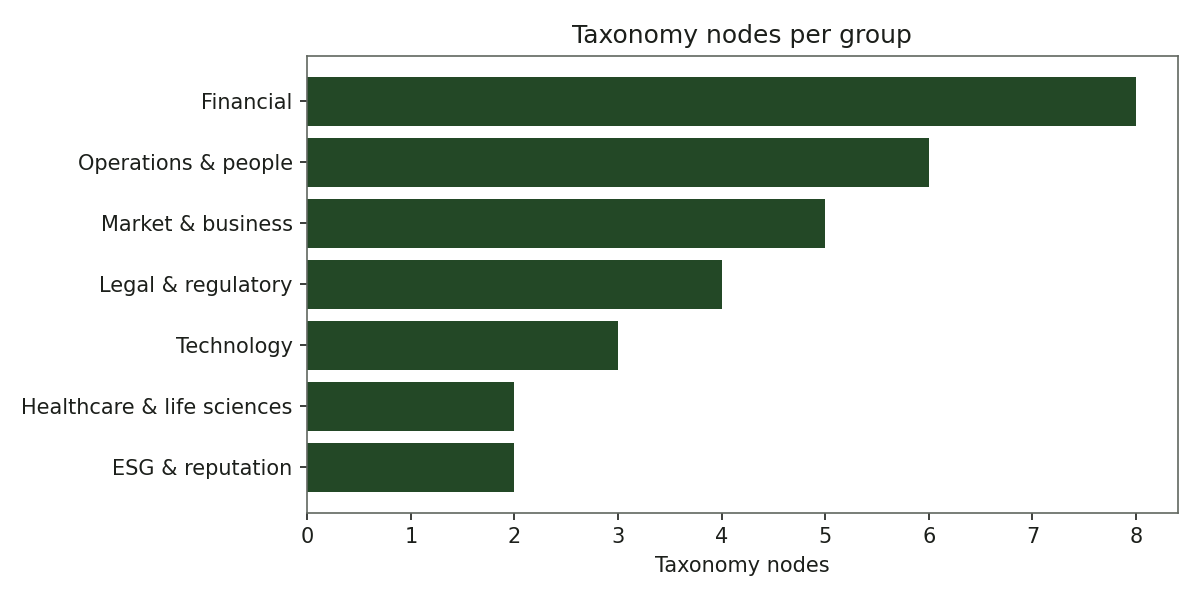
The taxonomy that shipped has ~30 nodes grouped under a handful of display headings. Here is how many nodes each group ended up with:
Takeaways
- Letting the taxonomy emerge from ~265K real filing phrases (rather than guessing categories up front) means the categories reflect what companies actually disclose, not what we assumed they’d disclose.
- HDBSCAN’s noise bucket is an honest signal of what doesn’tcleanly recur, and it’s cheap to sample and sanity-check by hand before finalizing the taxonomy.
- The taxonomy is intentionally frozen after this process so that risk-factor categorization is stable and comparable across runs. It gets revisited and re-run periodically as new filings surface risk themes we haven’t seen before — generative-AI risk being a recent example.
- This taxonomy isn’t just an internal modeling detail — it’s the exact set of categories every risk factor returned by the WealthWire API is mapped to, so this discovery process directly shapes what you see when you query the product.